MoneyWorks Manual
Creating an Analysis Report
Analysis reports can provide information from either the transaction file or the job sheet item file, both of which hold “raw data”, and hence can be usefully analysed. In this tutorial we will use the transaction file to create an analysis report to show who has purchased specific products.
- Choose File>New>New Analysis
The New Analysis window will be displayed.
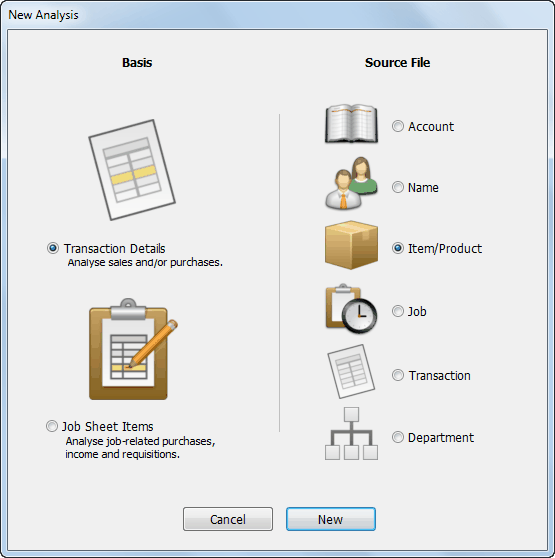
- Set the Basis to Transaction Details and the Source File to Item/Product as shown
An analysis report is always based on a Source File, which is used to select the transactions to be analysed1. In our example, we want to report on sales of specific products, so the product file will be the source file.
The Basis indicates where the information that we are analysing comes from. For this tutorial we want the transactions.
- Click New
The Analysis Definition window opens.
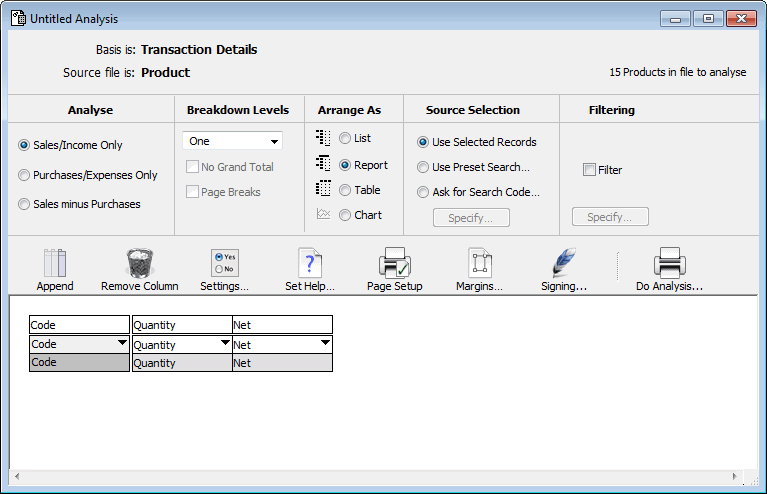
In this window we can specify the information that we want to appear on the analysis, and how the report will be formatted.
- In the Analyse part of the window, click Sales/Income Only
As this analysis is concerned with who purchased the selected products, we only want to look at sales.
- In the Arrange As section, click List
This determines how the information is displayed in the report.
The bottom part of the window displays the structure of the analysis. The fields on which the analysis will be done are in the left hand columns. The default setting has one label column called Code. The remaining columns show the information that will be printed, and are currently set to Quantity and Net. We’ll look at the default report, even though it is not quite what we want.
- Click the Do Analysis... button
The Analysis settings window will be displayed. We use this to select the output options and time interval for the analysis.
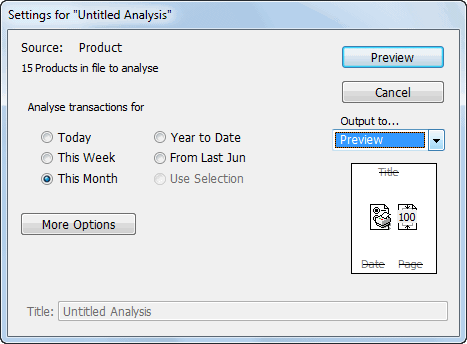
If your’s does not look like the one above, click the Fewer Options button.
- Click the Year to Date radio button
We’ll look at all sales for the year to date.
- Set the output to preview and click the Preview button
The analysis report will be displayed.
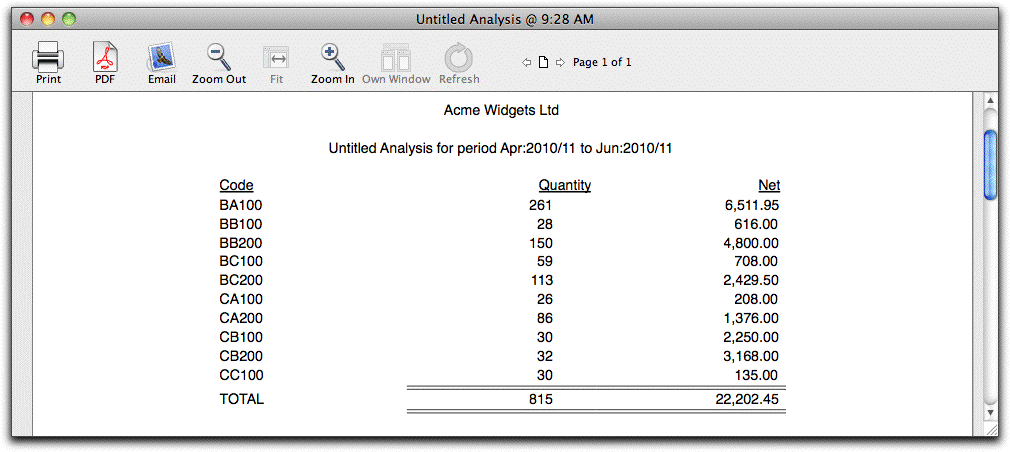
The report consists of three columns, each one corresponding to one of the columns in the setup window. To prepare the report MoneyWorks did the following (more or less):
- Stepped through each product in the product file (the source file)
- For each product, found all details lines in transactions that occurred this financial year.
- Added up the quantity and net for the detail lines.
The summary information for that product was then printed.
- Close the preview window
The analysis setup window will be the front-most window.
1 The transaction file itself can be the source file. In this case the analysis will be done on all highlighted transactions or, if there are none in the found set or if the transaction window is not open, all transactions. ↩