MoneyWorks Manual
Analysis Definition Options
In the Analysis definition window, you can define the information that you want to appear in the Analysis. The window is laid out in much the same way as the analysis will appear when printed, and defaults to a single label column and 2 columns of data.
Analysis reports consist of a set of columns across the page. There are two types of columns, label columns and data columns. The label columns always contain information indicating what is in the data columns (for example, a product or debtor code); the data column contains a calculated value (the net amount or the number of occurrences for example). The first column will usually be a label and will probably contain information from the source file (the job code for example). Depending upon the level of breakdown, there may be up to two additional label columns, drawn from either the source file or another file.
You cannot change the fonts, the column width or the formatting of numbers in an analysis report. However you can export the report and import it into either a spreadsheet or word-processor for subsequent reformatting.
The options in the window are:
Analyse: Determines the type of transaction or job sheet item records that will be included in the analysis.
For transaction based analyses these are:
- Sales/Income Only: Only cash sales and debtor invoice transactions will be included in the analysis.
- Purchases/Expenses Only: Only cash purchases and creditor invoices will be included in the analysis.
- Sales minus Purchases: All sales and purchases will be included in the analysis. Transactions representing purchases will be represented as negative values, whilst those corresponding to sales will be represented as positive.
For Job Sheet Item analyses these are:
- Incomings: Only job sheet lines created as a result of a debtor invoice or a cash sale will be included in the analysis.
- Outgoings: Only job sheet items directly entered into the job sheet item file or created as a result of an expense will be included.
- In - Out: All job sheet items will be included. Those representing incomings will be treated as positive, and those representing outgoings will be treated as negative (but will not be printed as such). The net result will represent a surplus or deficit for the analysed fields.
Breakdown Levels: This is the number of levels that the analysis will be printed for, and can range from none (total only) to three. There will be a label column for each level of breakdown.
Arrange As: This determines how the report is laid out.
List: The report is presented down the page. Totals are given after each change in the Label columns.
Report: Similar to the list format, but a separate heading is given for each change in the left hand most Label column.
Two additional options are available for this format. If No Grand Total is selected the printing of the grand total at the end of the report is suppressed. If Page Breaks is selected, a new page is started whenever the left most field value alters.
Table: The right most label in the analysis definition window is printed horizontally across the page, and the remaining labels are printed vertically as for a list. Only one numeric value can be analysed in this format.
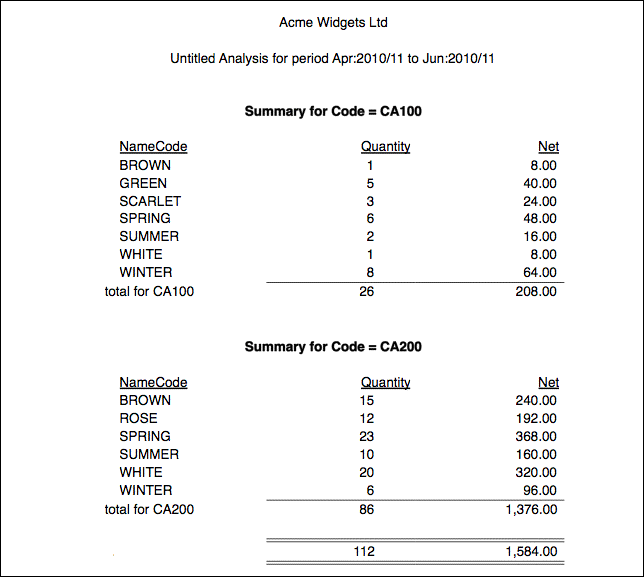
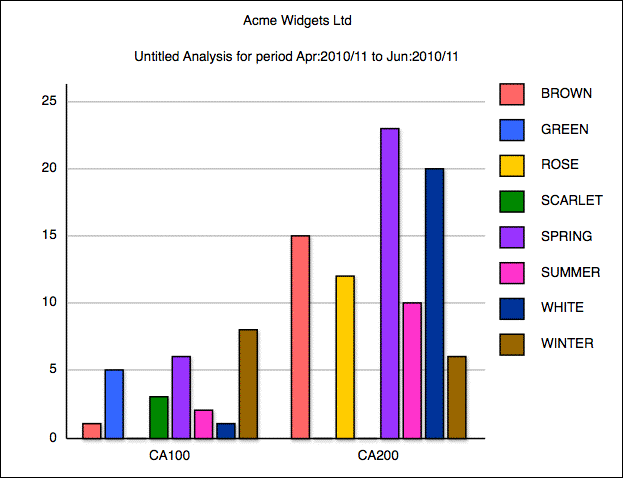
Chart: Similar to table, but the information is presented as a chart. By default this will be a column chart as shown, but you can select a different chart type by clicking the chart icon and selecting from the pop-up menu. You can also append the curve-type meta-characters (|S |L |C |Mn |P) — (see Chart) to the column heading to get a different form of graph. For example a heading of “Quantity|P” will produce a pie chart, whereas “Quantity|L” produces a line graph.
Source Selection
The Source Selection options determine how the source file records are selected.
Use Selected Records: If this is set, the user must identify the records in the source file to be analysed before the analysis report is printed. The records are selected by highlighting them in the source file list. If the source file list window is not open, all records in the file will be analysed. If the source file list window is open but no records are highlighted, all the records currently displayed in the list the found set will be analysed.
Use Preset Search: Selecting this option causes the standard Find window to be displayed see Find by Field. You set the search criteria in this, and this criteria is saved with the report. Whenever the report is printed, a search of the source file is undertaken using the criteria, and those records found will be analysed.
The preset search may be altered by clicking the Specify button. If the option key is held down and the Specify button is clicked the complex search window is displayed see Find by Formula.
Ask for Search Code: Causes the Setup Search window to be displayed.
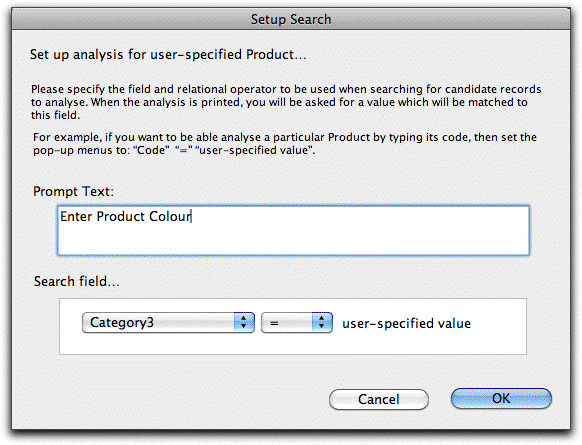
This allows you to specify some prompt text, and the basis of the search criteria. When the report is run, a window is displayed with the prompt text and a field into which the user can enter a pattern to complete the search criterion.
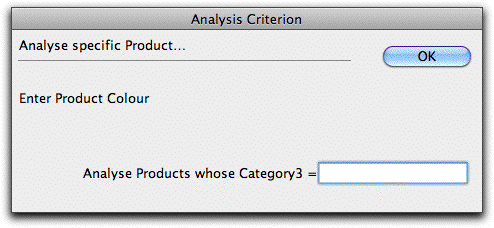
The source file is then searched for the matching records.
Filter
The optional filter function will filter the candidate detail or job sheet records based on the search expression. Only those records that match the source selection and the filter will be included in the analysis. When you select the filter option, the Advanced Find window is displayed for you to enter the search expression for the filter. If a relational search is used, it must terminate with [detail] or [Jobsheet].