MoneyWorks Manual
Analysis Column Settings
The information that will be appear in the analysis is determined by the settings in each of the columns in the analysis report.
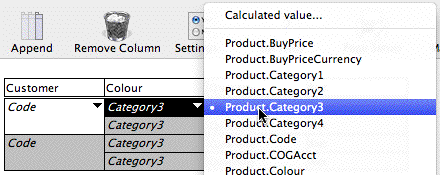
To change the settings for a column, hold the mouse down on the pop-up menu immediately below the column heading, and select the item required.
Label Columns
For Label columns, the pop-up menu will contain a list of field names from a variety of files. Select the field name that you wish to use (for further information on these fields see Appendix A—Field Descriptions). All records in the base file will be grouped by this field, and each occurrence of it in the base file will appear as a line in the report.
Calculated Value: Choosing Calculated Value (at the top of the menu) allows you to specify your own calculated breakdown in the Calculation window that opens. Calculations must be correctly formed expressions — see Calculations and things — pertaining to the basis and source files. The following expression for example will do a sales analysis by day of week:
DayOfWeek (lookup(Detail.ParentSeq, "Transaction. transdate"))
Value Columns
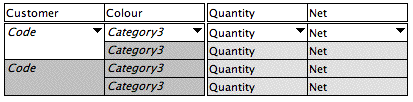
The pop-up menu for value columns contains a list of values that can appear in the report. These values will be aggregated for each combination of the label columns, as shown in the following table.
| Base File | Value | Description |
|---|---|---|
| Transaction Details | Count | The count of the number of detail lines. |
| Quantity | The sum of the product quantity field. | |
| Net | The sum of the values in the Net field, or (for a product transaction), the Extension field. | |
| GST/VAT/tax | The sum of the values in the tax field. | |
| Gross | The sum of the values in the Gross field, or (for a product transaction), the extended price including GST/VAT/Tax (this does not show on the transaction entry screen). | |
| UnitPrice | The average of the unit selling price field for product transactions (this will be zero in service transactions). | |
| CostPrice | The average of the unit cost price for product selling transactions, representing the average unit cost of goods. For buying transactions, it has the same value as the unitprice, so that margin calculations will be correct, and for service transactions it is zero. | |
| ExtCostPrice | The sum of the unit cost price multiplied by the quantity for product selling transactions. This represents the total cost of goods for the detail line. | |
| $ Margin | The difference between the Net and the ExtCostPrice. | |
| $Discount | The sum of the total discount for the detail line. | |
| % Margin | $Margin/Net displayed as a percentage. | |
| Job Sheet Item | Count | The count of the number of job sheet item records. |
| Quantity | The sum of the quantity field. | |
| Cost | The sum of the cost field. | |
| Value | The sum of the value field. | |
| $ Margin | The sum of the value field minus the sum of the cost field. | |
| % Margin | The $ margin divided by the sum of the value field. | |
| Budget | The sum of the budget (cost) field. | |
| Budget Variance | Budget - Cost. | |
| Budget Variance | Budget Variance divided by budget shown as a percentage. |
Changing the Number of Label Columns
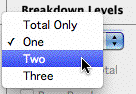
An analysis report can have between zero and three label columns (levels of breakdown). Zero columns corresponds to printing only totals.
To change the number of label columns use the Breakdown Levels pop-up menu.
Changing the Number of Value Columns
Use the Append and Remove Column toolbar buttons to change the number of value columns in the report. A report can have between one and ten value columns—a table can have many more.
By default the Auto Scale option (set in the Margins window) is on for analysis reports. This will scale the report to fit, regardless of the number of columns. To keep very wide reports legible, you should set the page orientation to landscape.
Column Headings
Each column in the report is assigned a heading.
To change a column heading, click on the existing heading and type in a new one. Although headings can be up to 31 characters long, they will be truncated if they are too long to fit on the printed report.