MoneyWorks Manual
Testing the Report
You can print or preview a report as you work on it to see how it is looking:
- Click on the Test Toolbar button or Choose File>Print (or press Ctrl-P/⌘-P)
The Report Settings dialog box appears.
Note: If you print the report by choosing it from the Reports menu and you have not saved changes made to the report, those changes will not be reflected in the printout that you get.
Report Errors
If you get an error in the report (for example, a badly formed expression or an uninitialised variable), an error dialog will be displayed with the error and part number on it (the offending part or cell in the report is also highlighted). If you want to see the report produced thus far, hold down the option key (Mac) or the Ctrl key (Windows) when you click the OK button in the error dialog.
Tip: To get a trace of the report (to help you debug it if something is not correct) hold down the Option key (Mac) or Ctrl key (Windows) and a trace of the report will open, detailing each part as it is calculated.
Report Profiling
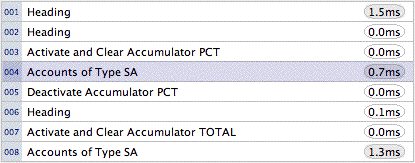
When you test the report from the report writer window, the execution time for each part of the report is recorded and displayed alongside the part (you will only see this if the part selection bar is fairly wide). Profile times are displayed in milliseconds. Parts that were not executed (for example, where an “if” part evaluates to false) will have no time displayed. Parts that take longer than a millisecond to execute will have the time shown with a darker background.
