In this, the first newsletter of the antipodean spring …
- MoneyWorks 9.1.9
- New Sales Explorer Dashboard
- macOS Sequoia
- Microsoft email changes
- Upcoming Training
- Tip du Jour
MoneyWorks 9.1.9
MoneyWorks 9.1.9 is now available. As well as the usual reliability and performance enhancements, this update contains a number of new features:
Sales Explorer Dashboard Chart
The new Sales Explorer dashboard allows you to easily explore trends of product sales to customers, and relationships between customers and products (see below).
New Columnar P&L Reports for Departments
Using the breakdown facility when running a report has always been an easy way to generate separate reports for department. The new Department Profit and Loss reports (in Reports>Profit and Loss) will produce a report of the nominated departments with each department in its own column, allowing you to easily compare the performance of up to ten departments.
Better tax code handling
In MoneyWorks Gold, you can now import tax codes, to either add new taxes or update existing rates. You can also change existing tax codes.
Overlay option in Ledger Chart
You can now add an overlay line to the Ledger Chart. The overlay can be one of the budgets, or a fixed or rolling average, to better discern trends.
For a complete list of changes, see the MoneyWorks 9.1.9 change notes.
New Sales Explorer Dashboard
As you use MoneyWorks, it is gathering a lot of information about what you are selling and who you are selling it to. The new Sales Explorer dashboard (supported on macOS and Windows 10 or later), enables authorised users to explore which products or product types are selling (or not selling), and who is purchasing them.
The dashboard is divided into two charts, one for product sales and one for customer sales. The charts are linked, allowing cross filtering between the two. For example clicking on customer “Brown Suppliers”, on the right hand (customer) chart below, would cause the left hand product chart to display just the sales to them for the slelected time interval.
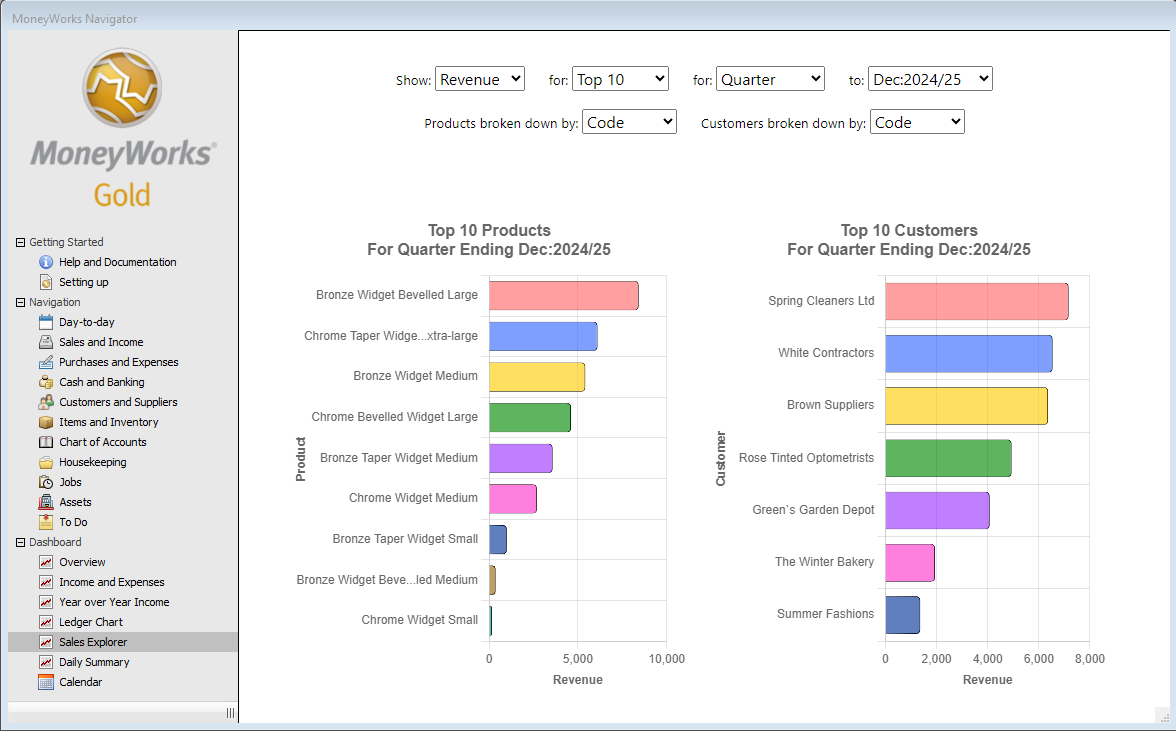
The new Sales Explorer gives insights into product sales and customer purchases
The chart, which is based on posted transactions, is determined by the settings in the pop-up menus at the top of the explorer.
- Use the Show pop-up menu to select the type of sales data to display (e.g. Revenue, Quantity, Margin).
- Set the number of items to chart (e.g. Top 5, Bottom 10).
- Set the time frame using the For and Until pop-up menus.
- Use the two Breakdown menus to determine how the data in each chart is displayed. For example, in the Acme Widgets sample file the type of product (Bronze, Chrome, Aluminium) is stored in the product Category1 field. Setting the breakdown pop-up for the product chart to Category1 will summarise the product chart by just those categories, and clicking on (say) Chrome will show the customers purchasing Chrome products.
- Hover over a segment of the chart to display the full product/customer code and the actual value.
macOS Sequoia
The new version of the macOS (Sequoia) was released earlier this week.
Although we have found no issues with MoneyWorks and Sequoia, one significant change is the increase in the nagging level for permissions. You may notice this the first time you attempt to connect to MoneyWorks Datacentre or MoneyWorks Now, when this alert may appear:
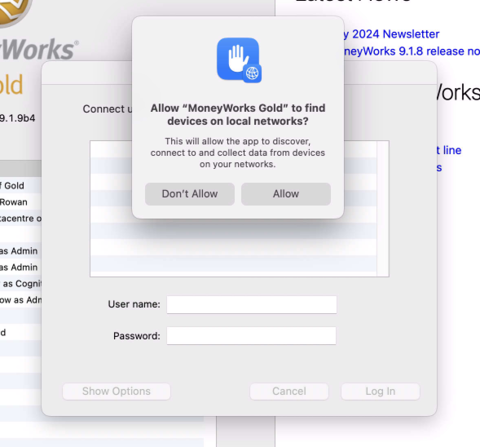
If this happens, it is imperative that you click “Allow”, otherwise MoneyWorks will not be able to find your Datacentre. In this case you need to go to System Settings → Privacy and Security → Local Network, and turn on the switch next to MoneyWorks Gold.
Microsoft email changes
Using Microsoft SMTP? You will need to change to OAuth authentication.
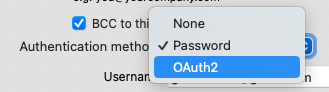
Microsoft have announced that they will soon start blocking password-based login from third-party apps for sending email via their email servers. This may affect MoneyWorks users who use Microsoft SMTP to send emails, as, hitherto, MoneyWorks has used this feature. MoneyWorks 9.1.9 now supports OAuth login which you will need to continue using Microsoft SMTP.
You can check your email settings by going to the Emailing tab in the MoneyWorks Preferences. If it is set to “Send messages directly via a mail server”, and if the specified SMTP Server is a Microsoft one such as outlook or office365, you need to change your Authentication method to OAuth (you will then be prompted to log in to Microsoft’s web site to grant access).
Upcoming Training Courses
We have scheduled training courses on Wednesday 25th September and Tuesday 22nd October in our Auckland training room. For more details, or to book your place, see cognito.co.nz/support/training/
We can also do targetted on-line training, normally using zoom. If you are interested in organising a one-on-one or group session please email info@cognito.co.nz.
Tip du Jour
Adding filters to the Ledger Chart
The Type setting in the Ledger Chart gives views of the general ledger that we think are useful (such as sales, profit, bank balances). But you can also add your own filters to leverage off the structure of your chart of accounts, for example you might just want to include accounts that start with “10.”, or have a category of “Region”.
Any filters that have been created in the Account Enquiry will be automatically appended to the Type pop-up menu.
To create such a filter:
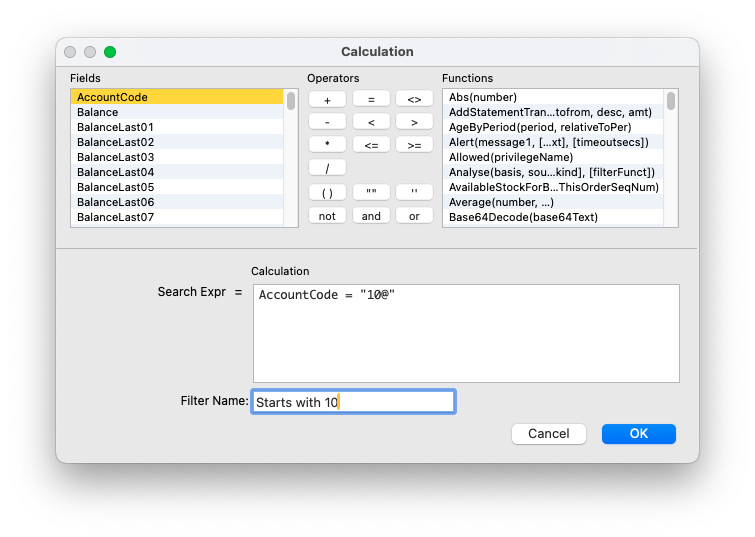
A filter for accounts starting with “10”
- Open the account enquiry by choosing Account Enquiry from the Enquires menu.
- Choose Edit… from the Select popup menu at the top left of the enquiry window.
The list of filters will open. - Click the New button to create a new filter
A new filter calculation window will open - Type in a search expression to identify the ledgers you want.
The available fields to search in the ledger file are listed - Give the filter a meaningful name
This is the name that you will choose to apply the filter. - Click OK to close the filter window.
- Close the filter list window.
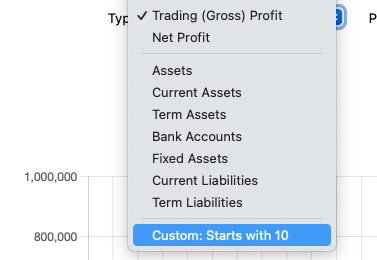
If you now return the the Ledger Chart in the navigator and refresh it by right-clicking and choosing Reload (macOS) or Refresh (Windows), you should find your custom filter at the bottom of the Type pop-up menu.
Printing the Ledger Chart or Sales Explorer
Windows users can right-click on either chart and choose Print to print the chart. Mac users will have to content themselves with a screen shot.